Real-time tracking
Instantly view energy and cost savings as they happen.
Svensson Energy Monitor is a real-time monitor in LetsGrow.com that visualizes savings (and missed savings) in energy and money when using climate screens. It provides automated advice for the right screen strategy, helping growers get the most out of climate screens.
Based on data from the climate computer, Energy Monitor calculates and shows current and historical savings using climate screens. Linked to this, Energy Monitor gives automated advice on how energy savings can be maximized by modifying the screen strategy. Climate House Advisory is included.
Instantly view energy and cost savings as they happen.
Get tailored advice to improve climate screen performance.
Track and reduce CO₂ emissions for sustainable energy management.
Access trusted support to maximize your energy-saving potential.
Energy Monitor connects to your existing climate computer and works with the LetsGrow.com platform to track temperature, humidity, and screen positions in real time. It calculates current and historical energy savings, compares actual performance with potential savings, and highlights opportunities for improvement. Based on this data, Energy Monitor recommends optimal screen strategies through one clear, easy-to-use dashboard.
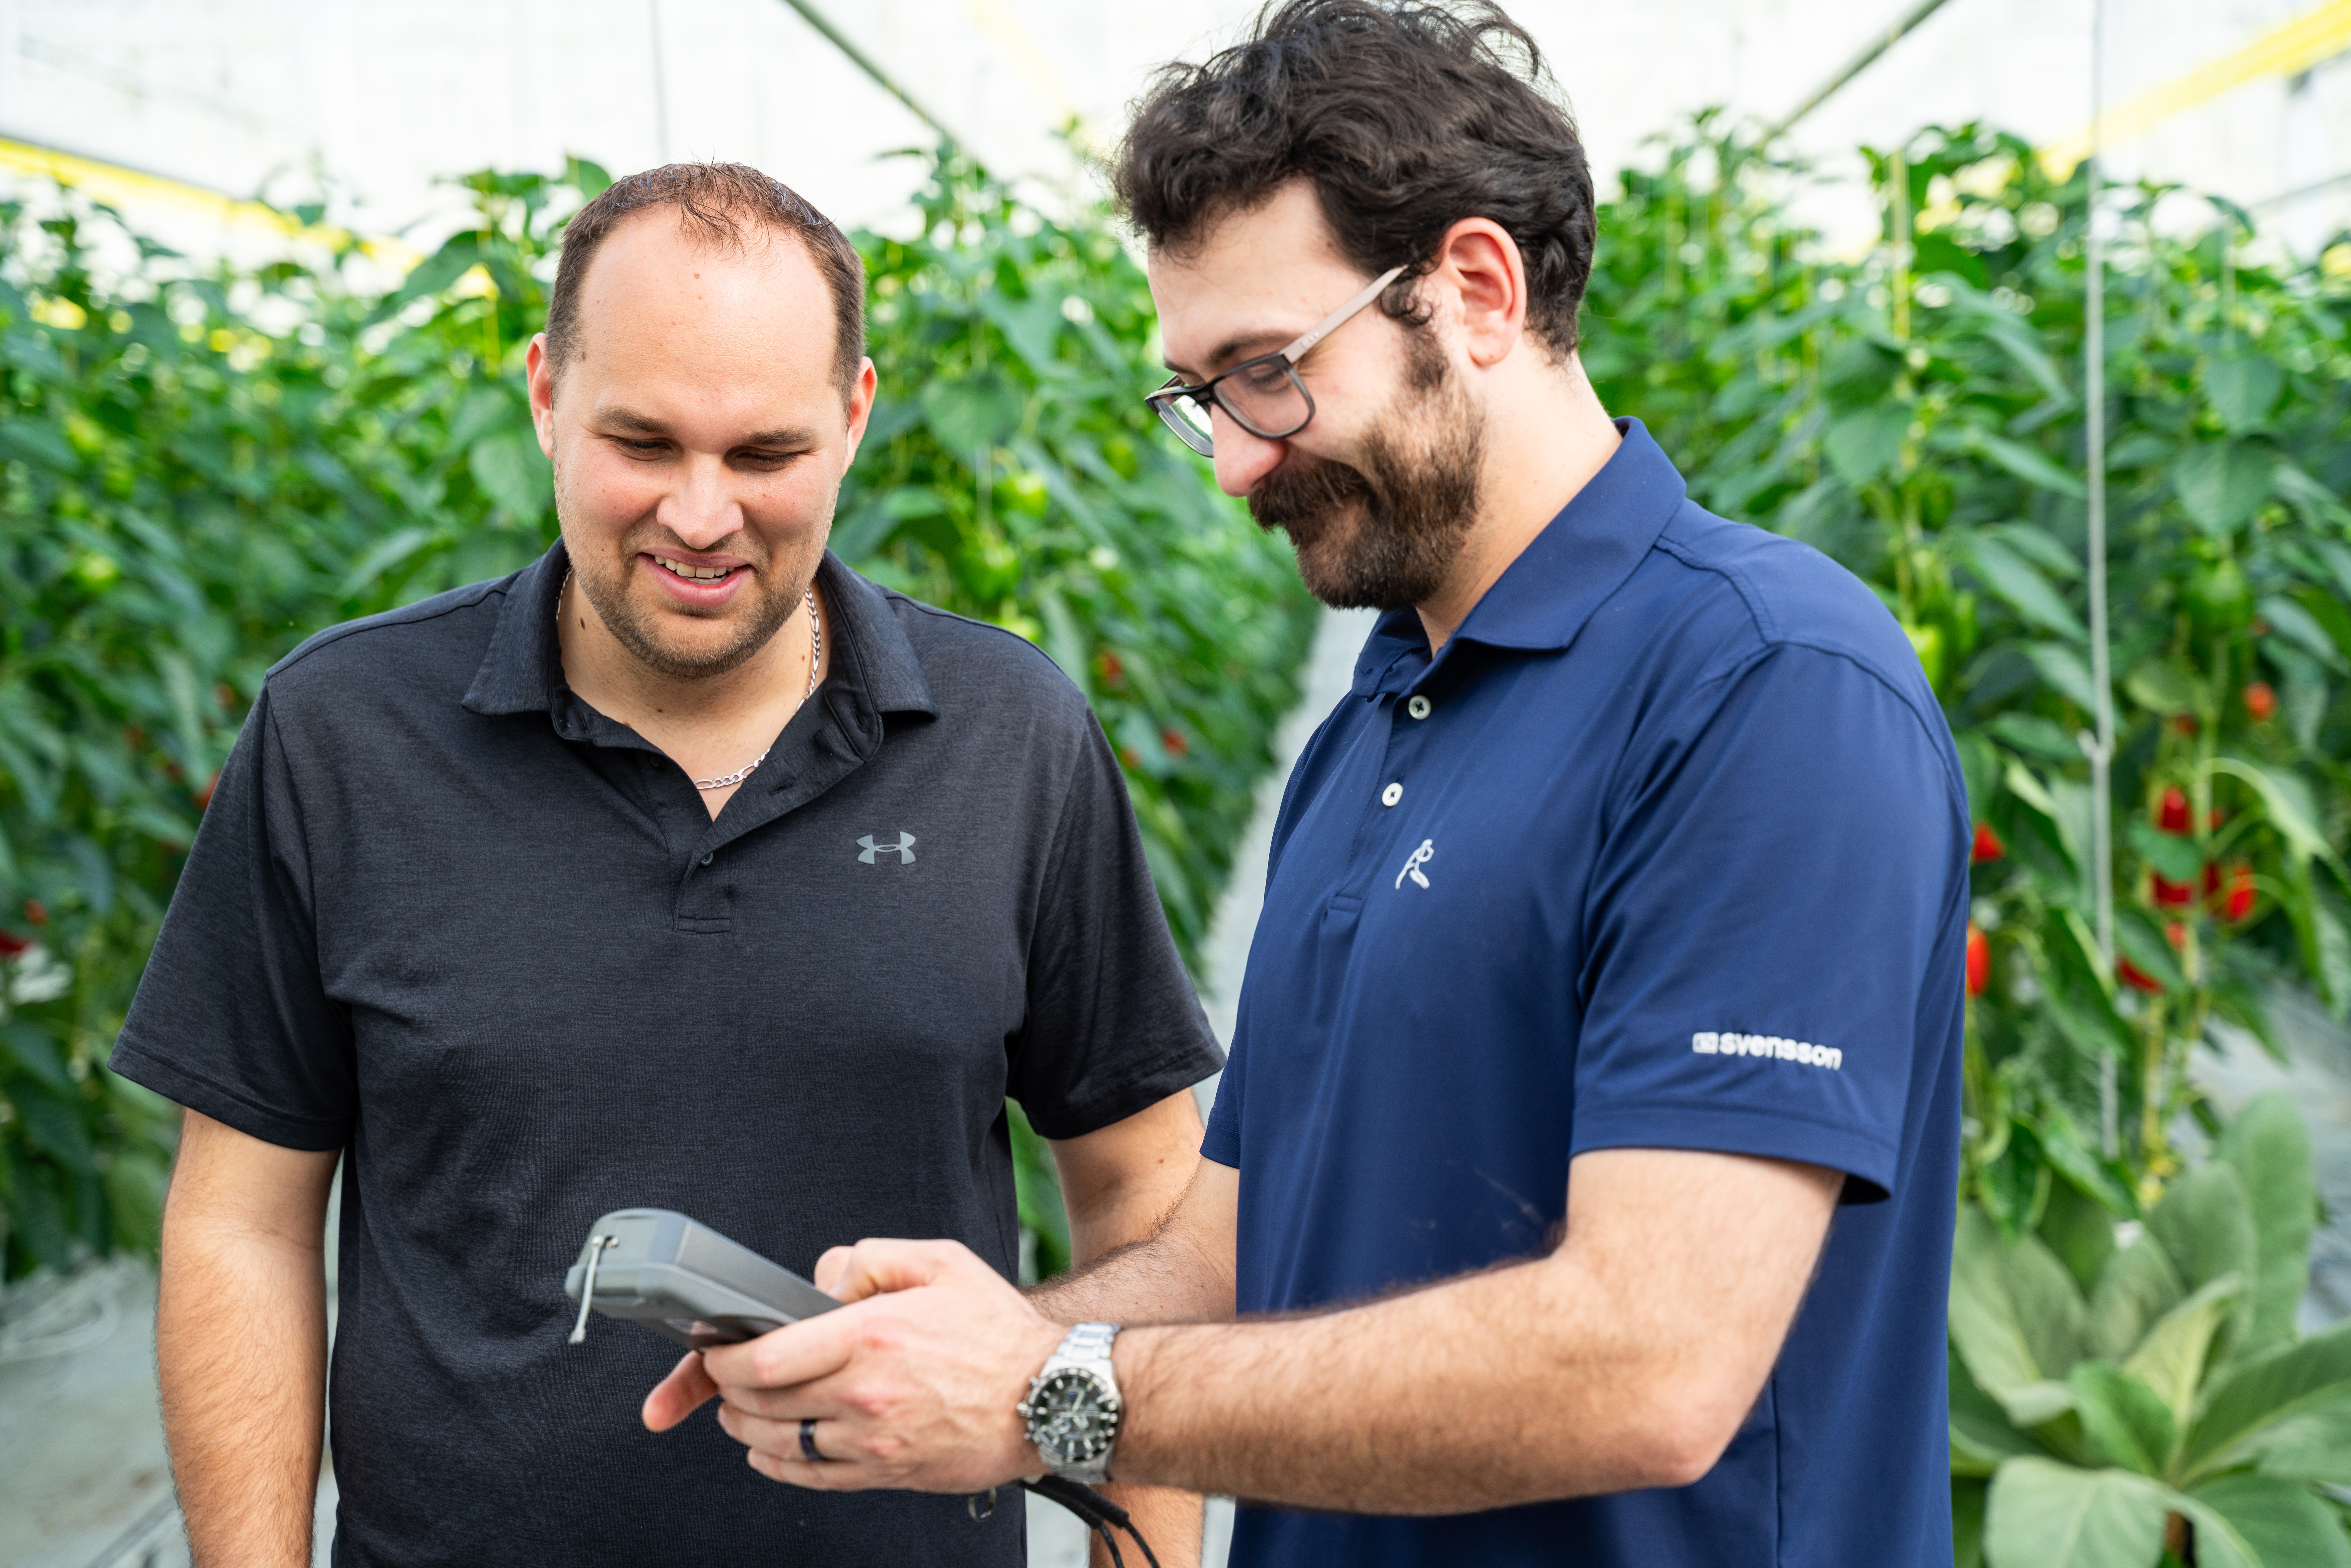
To help you get the most value from the system, Svensson Climate Consultants support you through our advisory services. Together, you review Energy Monitor data, fine-tune settings, and evaluate screen strategies in relation to crop performance to ensure the best possible results.
Report
The Inside Energy Monitor report brings greenhouse data to life by showcasing real Energy Monitor dashboards from growers around the world. It walks through how different operations track energy use, screen behavior, and climate performance, revealing both achieved savings and missed opportunities. By highlighting real scenarios and insights pulled directly from grower dashboards, the report shows how data-driven screen strategies can improve energy efficiency, support better climate control, and drive more confident decision-making in the greenhouse.
Data is powerful—but results speak louder.
15 Aug 2025 | Tomato
TVA Growers upgraded to Luxous Light FR and Energy Monitor in 2024, continuing their trusted, energy-efficient collaboration with Svensson and Alweco.
16 Jul 2025 | Tomato
The privately held Haoyu Group has entered greenhouse growing, begun constructing its own glasshouses and pioneered new approaches to sustainable growing in just six years. It is now working with Svensson's Energy Monitor on advanced algorithmic screen control.
22 Apr 2025 | Peppers
Discover how Twin Creeks improved climate uniformity, crop performance, and energy efficiency with ClimaFlow, double Luxous screens, and Energy Monitor.
Let’s talk about how Energy Monitor helps you understand performance, identify savings opportunities, and make smarter climate decisions.
Energy Monitor is a digital analysis tool that tracks how your climate screens are used and calculates the energy savings they deliver. It also identifies the potential savings you’re missing — the “uncaptured” energy and CO₂ that could be saved with better screen use.
Because screens have the largest influence on greenhouse energy balance. Small changes in closing time, gap size or duration can add up to big differences in energy use. Energy Monitor quantifies those effects in real numbers.
It converts measured or estimated energy use into CO₂ emissions using standard energy-source factors. That means you see not only how many kilowatt-hours you’re saving, but also how much carbon emissions you’re preventing — or still emitting unnecessarily.
They’re the energy and CO₂ reductions that could have been achieved if the screens had been used optimally. Energy Monitor highlights those opportunities and shows exactly where and when energy was lost — for example, through late screen closure or unnecessary ventilation.
No. It also confirms what’s working. You can see verified savings from your current strategy, plus the remaining potential. It’s a way to celebrate the gains you’ve made and identify what’s still on the table.
Yes. Based on your climate data, Energy Monitor can suggest alternative screen strategies to capture the identified potential — showing, for instance, how adjusting timing or screen combination could save more energy and cut emissions further.
Clear metrics: energy saved (kWh or MJ), CO₂ reduced (kg or tonnes), and the financial value in euros. The tool translates technical performance into economic impact — showing exactly what efficient screen use is worth.
Growers and consultants who want a data-based view of screen performance. It’s especially useful for operations with multiple houses, crops or climate zones, where comparing efficiency can lead directly to cost savings.
By making energy and CO₂ performance visible. Energy Monitor turns efficiency into a measurable sustainability action — helping you report and improve your results with confidence.